Pie Charts

A circular graph that's divided into sectors. It shows the numerical proportion of the data. Pie charts are often difficult to create without technology.
Bar Graphs
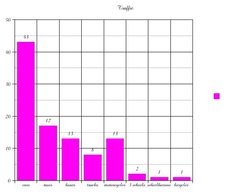
A bar graph uses horizontal or vertical bars to demonstrate the comparisons of different categories.
Stem and Leaf Plots
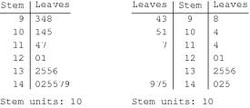
Stem and leaf plots put numbers in ascending order. The stem must always be labeled in the correct units. Stem and leaf plots may use split stems, which separate the stems into five number increments, instead of ten. A back to back stem plot may be used to compare two sets of data.
Histogram
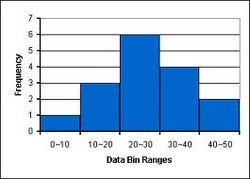
Histograms are stem and leaf plots on its side and without the individual numbers. Histograms use touching bars and put the data into groups. It's an estimate of the probability distribution.
